Monday, 21 March 2016

Reflection

After this long experimental process it is time to reflect.....

What would I change in my experiment if I could complete it again?

- I would conduct more background research to broaden my knowledge, relating to my           experimental hypothesis, before commencing the practical phases
- I would have been more organised in gathering all materials and items needed so my           experiment could be more accurate 
- I would repeat my experiment a further 2 times to ensure the experimental results are        
reliable 
- I would have taken more time when measuring different materials to improve the validity of   my experiment and may have considered filtering the liquids at home before the                     experimental lesson to save time

The outcomes for this experiment where overall successful.

I measured turbidity of the filtered and non-filtered liquids and then calculated and graphed the difference between the average turbidity’s of the filtered and non-filtered liquids. At the end of my experiment the average difference between the filtered and non-filtered dirty water was 671.2NTU, the black tea was 84NTU, the Coca-Cola was 56.5NTU and the soapy water was 131.1NTU. The turbidity of the dirty water will change the most drastically when it is filtered, followed by the soapy water, then the black tea and finally the cola-cola. There is not evident trend from my results although, it can be assumed that the turbidity’s of the liquids that had larger particles in them (such as the dirty water and the soapy water- dirty particles and bubbles made from the detergent) changed more drastically when filtered than the liquids (Coca-Cola and black tea) in which had dissolved particles in them. 

Conclusion: In conclusion, the effective water filter successfully filtered different liquids, causing the turbidity of the liquid to change. The turbidity of the dirty water changed the most drastically when it was filtered followed by the soapy water, then the black tea and finally the cola-cola, therefor proving my hypothesis to be correct. 

Overall I would say this was a successful project and I am very pleased with the result. Thank you for being a part of my Science Experiment for 2016. 
Discussion

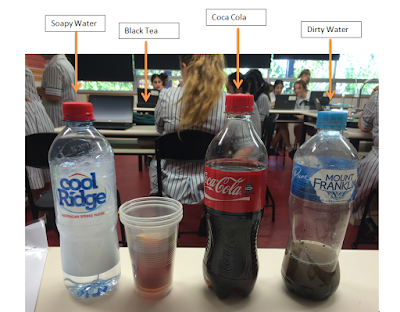
In reference to that shown in the results the outcome of my experiment was relatively what i had predicted in my hypothesis and expected. I measured turbidity of the filtered and non-filtered liquids and then calculated and graphed the difference between the average turbidity’s of the filtered and non-filtered liquids. At the end of my experiment the average difference between the filtered and non-filtered dirty water was 671.2NTU, the black tea was 84NTU, the Coca-Cola was 56.5NTU and the soapy water was 131.1NTU. The turbidity of the dirty water will change the most drastically when it is filtered, followed by the soapy water, then the black tea and finally the cola-cola. There is not evident trend from my results although, it can be assumed that the turbidity’s of the liquids that had larger particles in them (such as the dirty water and the soapy water- dirty particles and bubbles made from the detergent- as shown in the picture below) changed more drastically when filtered than the liquids (Coca-Cola and black tea) in which had dissolved particles in them. 
Reliability: I only completed my experiment twice which may have led to unreliable results. This experiment should be repeated several time to ensure the same result is obtained using the same method. Further testing could have been carried out to ensure reliable results. I carried out two experimental tests for my experiment, however for extremely reliable results I could have done a further test, in which would have created more accurate outcome/results of my experiment. 

Accuracy: In order to effectively improve the accuracy of this experiment, the equipment used for testing could have been more accurate. I have not used a turbidity meter before and thereby was not familiar with this sort of technology. Although I was shown a demonstration on how to use the turbidity meter I could have done more research and become more familiar on how to use the turbidity meter, thereby using it to its full potential. When I washed the sand and the gravel I used my hands and cleaned as much dirt and other unwanted particles out of these materials, although some particles of dirt may still be presents in these items. To improve the accuracy of the cleaning of these materials I could have repeated the cleaning process numerous times, and after each time letting the water drain out of the materials. This will improve the purity of the sand and the gravel, in which if they still have unwanted dirt in them, could affect the results/outcome of my experiment as these dirt particles could drain into the filtering liquids, affecting the turbidity. 

Validity: To effectively improve the validity of this experiment, all variables needed to be controlled. The measurements of the components of my natural water filter (sand and gravel) should be controlled to prove fair results, although whilst measuring these liquids I may have been rushing and estimated different amount of liquids. This could affect the filtering capability of my natural water filter, causing my results to be invalid. In order to overcome this issue I need to take more time when measuring the amount of materials I need for my experiment, thereby proving more valid results.


Saturday, 19 March 2016

Was my Hypothesis Correct?

My hypothesis is as followed: 'The turbidity of the dirty water will change the most drastically when it is filtered

The outcome of my experiment was the same as my hypothesis as the turbidity of the dirty water changed most drastically than the other liquid when it was filtered. In the dirty water I added a small bowl of garden dirt to 1 cup of water and 1/4 teaspoon of vegetable oil. The turbidity of a liquid is the cloudiness or haziness of a fluid caused by large numbers of particles that are generally invisible to the naked eye. The other liquids I tested including black tea, soapy water and Coca-Cola did not contain as large particles as the dirty water (as the soil does not dissolve in water) therefore when these liquids where filtered they did not change their turbidity’s as drastically as the dirty water did. This is the reason why the turbidity of the dirty water (671.2NTU) changed more drastically than the Coca-Cola (56.5NTU), black tea (84NTU) and the soapy water (131.1NTU)

Below I have attached a video, to help explain how I have conducted my experiment, hopefully making it easier to understand: 

Results + Photos

I have completed my experiment and recorded all results in a table. I measured turbidity of the filtered and non-filtered liquids and then calculated and graphed the difference between the average turbidity’s of the filtered and non-filtered liquids. At the end of my experiment the average difference between the filtered and non-filtered dirty water was 671.2NTU, the black tea was 84 NTU, the Coca-Cola was 56.5NTU and the soapy water was 131.1NTU. The turbidity of the dirty water will change the most drastically when it is filtered, followed by the soapy water, then the black tea and finally the cola-cola. 
My results table is as follows: 


My results graph is as follows:


Comparison photos of the non-filtered and filtered liquids: 

BLACK TEA:
     - Smell of tea changed – not as strong
-    - Colour of filtered tea became lighter
-    - Bubbles formed at the top of the liquid
-    - Tea became cold
-    - Took roughly 20+ minutes to filter fully


DIRTY WATER:
-     - Colour of filtered water became lighter
     - No dirt particles present to the human eye in filtered liquid
-    - Took roughly 20+ minutes to filter fully


COCA-COLA:
-    - The colour of the liquid changed – became lighter
-     - More bubbles formed
-     - Took roughly 10-15 minutes to filter
-     -  Smell changed- reduced 


SOAPY WATER:
-     - Took roughly 15- 20 minutes to filter fully
-     - Bubbles rose to the top of the liquid
-     - Bubbles still visible in liquid
-     - Colour changed (due to other liquid residues)

Tuesday, 15 March 2016

Background Research -Turbidity (Article)

Today I decided to complete some more research about Turbidity and the issues surrounding this topic. Using http://water.usgs.gov/osw/techniques/TSS/ZieglerT.pdf I have written a brief summary of my understanding of the article (see below):

Turbidity Definition: 
Turbidity can be defined as a decrease in the transparency of a solution due to the presence of suspended and some dissolved substances, which causes incident light to be scattered, reflected, and contracted rather than transmitted in straight lines; the higher the intensity of the scattered or attenuated light, the higher the value of turbidity. 
Turbidity can be expressed in nephelometric turbidity units (NTU). Depending on the method used, the turbidity units as NTU can be defined as the 'intensity of light at a specified wavelength scattered or attenuated by suspended particles or absorbed at a method-specified angle, usually 90 degrees'. 

Issue Relating to Turbidity Measurement: 
Different Turbidity methods, standards, reporting of units, and instruments are not identical meaning that because turbidity is an apparent optical property of water, it is likely that dilution of samples would not result in a physically reproducible measurement. 


Light wavelengths are different, and color can affect the measurements. Different instruments may use forward or backscatter detection devices and multiple incident light sources and detection devices at different orientations that can compensate for the effects of color and grain size. Therefore, measurements of the same water by different methods and different instruments are not likely to produce similar values.


The color of water can cause a negative bias in measurements by constricting the light in colored samples. The color of the darkened sediment particles has been shown to substantially affect measurements with optical backscatter meters, and it is expected that nephelometers would give a similar negative bias in measurements depending on the minerals in the sediment . 
All turbidity meters can be affected by the grain size and orientation of the sediment in a sample liquid.

Sunday, 13 March 2016

Variables in my Experiment

Variables: A variable is any factor that can be controlled, changed, or measured in an experiment. These are the variables in which I needed to change, measure and control whilst completing my experiment: 

Independent variable: The type of liquid (I used four different liquids to experiment with including Coca-cola, Dirty water, Soapy Water and Black Tea)

Dependent variable: The turbidity of the liquids before and after they are filtered (I measure the each liquid before and after it was filtered using a Turbidity Sensor) 

Controlled variables: Same amount of each liquid being filtered, same type of filter (with same amount and type of materials), same amount of liquid used when testing the turbidity, same type of equipment used to measure the turbidity

Variable that needs to be controlled
How this variable will be controlled
Same amount of each liquid being filtered
Use a measuring cup to measure exactly 1 cup of the liquid that you will be filtering. 
Same type of filter (with same amount and type of materials) (this includes the amount of filter paper used)
Use the same filter each time you are filtering the different liquids. Make sure you use a measuring cup to measure exactly 1 cup of each material that is made up of the filter.
Same amount of liquid used when testing the turbidity
Only fill the glass bottles up to the line when testing the turbidity of each liquid using a turbidity meter.
Same type of equipment used to measure the turbidity
Only use a turbidity sensor to measure the turbidity of each liquid.

Sunday, 6 March 2016

Conducting my experiment in class

During last thursday and friday's science lesson we were given an opportunity to conduct our SRP's. I had to make a few changes to the materials I used. I did not end up using the 'activated charcoal' as I was not able to buy the charcoal in time for my experiment. I got some charcoal from my house fire but realised that this was not the same as activated charcoal and did not contain the same properties as activated charcoal does in relation to filtering different liquids. Below are some photo's of my experiment:


The setup of my experiment:


Liquids I used for my experiment:


I used a data logger with a turbidity sensor attached to measure the turbidity of different liquids (Picture of this measurement tool below): 


Below is a video of liquid being filtered:

I have also attached a comparison picture of the liquids before and after they have been filtered. I will post about my results in a later post. 
Liquids before they are filtered:


Liquids after they have been filtered:

Reason behind my experiment

When you're thirsty, nothing is better for you than a glass of water. All you have to do is turn on the tap and fill your glass, open a bottle of water, or go to your refrigerator's water dispenser. According to the World Health Organization, every year approximately 1.6 million people die from illnesses (usually severe diarrhea) due to drinking unsafe water as it is contaminated and unclear. Another side effect of lack of access to clean water is gender inequality. The chore of gathering water for the family usually rests upon the shoulders of female family members, especially girls. If girls are gathering water all day, then they don't have time to go to school. Thus, access to clean water can result in a population that is not only healthier, but that is better educated, and more able to help improve their community because they are not sick. In the year 2000, the United Nations member countries put together the Millennium Development Goals. The purpose of this program is to reduce poverty and hunger, to tackle ill health, gender inequality, lack of education, lack of access to clean water, and environmental ruin. Access to clean water plays a big part in reaching many of the Millennium Development Goals. 

I wanted to do an experiment that was education and taught me something new. While doing this science project, I thought about all the important science and technology that exists to improve people's lives, like devices to clean their water! I realised that, if we give the people in these unfortunate counties the necessities needed to build their own water filters they will be able to filter their own water and 1.6 million people's lives would be saved annually due to them having access to clean water.  

Friday, 4 March 2016

Constructing the Water Filter

On the 3/03/2016 and 4/03/2016 I completed my SRP experiment at school. I really enjoyed doing this but before I talk about my experiment I would like to mention the preparation I did leading up to the experiment. 

A few days before my experiment I went to Bunnings and Woolworths and bought some of the materials needed for my experiment. I did not end up using the charcoal in my filter because I sourced this material from my house fire and when I was putting the filter together realised that the charcoal was not 'activated' meaning that it would not work in my experiment (I will go into more detail about this in my discussion). Then the night before my experiment I constructed my natural water filter using the method provided below: 
Materials Needed for my Natural Water Filter


1. Use a rubber band and secure the filter paper to the mouth of the bottle with it bottom cut off. 


2. Measure out 1 cup of pebbles, 1 cup of fine sand and 1 cup of course sand. Rinse the pebbles in the water carefully three times to remove any dust. Put the sand in another bowl. Rinse the sand in water carefully three times. Swish the sand in the water then let it settle before your drain off the water.
    
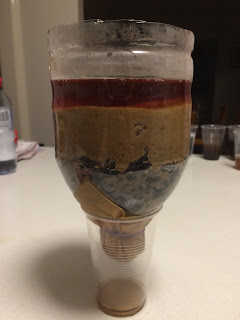
   3. Pour the pebbles in the bottle. Then pour the course sand on top of that. Then pour the fine sand on top of the course sand. Below is my finished 'Natural Water Filter'. I tested the filter by filtering tap water through it. This filter was used in my own experiment


Tuesday, 1 March 2016

Results Table

Prior to my experiment I have decided to create a results table in which I can record my results during my experiment. I have created a table using Microsoft Word. It is important to organize my results in a clear way and I feel as though a table will do just that. This will help me with the process of conducting my results and for the process of making my graph. 

Below is my a copy of my results table which I have constructed to record my results in an organized fashion:

Turbidity of Liquids before and after they are naturally filtered

Liquid
Turbidity of liquid before it is filtered (NTU)
Turbidity of liquid after it is filtered
(NTU)
Dirty water


Soapy Water


Coca-Cola


Black Tea


The units in which Turbidity is measured in is NTU: Nephelometric Turbidity Units. The instrument used for measuring turbidity and that I will be using is called a turbidity meter which measures the intensity of light scattered at 90 degrees as a beam of light passes through a water sample. 

Natural Water Filter (Background Research)

Today I visited my local bunnings warehouse to buy the materials needed to make the natural water filter. A natural water filter is a filter which is made of natural materials such as pebbles, sand and charcoal in which removes dirt and other substances from a liquid. 


Materials I brought from Bunnings 

Example of the Water Filter I will be constructing 
Importance of Clean Water

Water covers two-thirds of the Earth's surface and makes up about 60% of adult's bodies, including 75% of our brains! Each day we need to consume more than two liters of water through liquids we drink and foods we eat. Although there's plenty of H2O around, much of it is either inaccessible or inconsumable to humans due to its cleanliness. But with water treatment, we're able to purify water and get clean drinking water that can be used in many poorer countries in the world who do not have access to clean water. 

How does it work?

Each time the water passes through a different layer, it becomes cleaner. First, the gravel/rock layer catches large pieces of debris, such as twigs, leaves, and bugs. Next, the sand layer catches smaller particles, such as dirt and grit, and makes the water look clean. Finally, the charcoal layer gets rid of bacteria and some chemicals and the fine sand layer extracts even smaller particles that the other layers could not pick up. 

I have also been to Woolworths to gather items for my experiment including: coffee filter paper, plastic spoons and cups and Coca-Cola etc.